
 2 months ago
15
2 months ago
15
PROTECT YOUR DNA WITH QUANTUM TECHNOLOGY
Orgo-Life the new way to the future Advertising by AdpathwayDisclaimer: This site is not affiliated with the National Hurricane Center, Hurricane Hunters, Storm Prediction Center, or National Weather Service. ALL forecasts herein are the result of my analysis, (to which you will see me at times, insert excerpts from various agencies due to the nature of the importance of the information) and I am solely responsible for the content. As ALWAYS, follow the National Hurricane Center, National Weather Service, and your local Emergency Management officials for emergency decisions. In addition, this is strictly a FORECAST OFFICE. I CANNOT make decisions regarding travel plans, etc. My purpose, is to provide you the information, based solely on information I analyze, and the accuracy of the information at hand of the time of analysis, so you may make informed decisions.
(T. F. “Storm” Walsh)
For those who have donated to my site, your help has been greatly appreciated. If you are not aware, donations to my site help pay for subscriptions to sites I use as well as software updates, which provide all the models and information used in my forecasts. To donate, please click the DONATE button to the right side of the page, or on the graphic of the dog. Any help you provide is immensely appreciated!
DONATIONS ACCEPTED AND APPRECIATED


I will reiterate, my forecasts are based on the available information at the time of analysis, and are only as accurate as the information analyzed and the solutions provided.
Good day everyone!
The regular forecast schedule is generally Mon., Wed. Thu., Fri. and Sat., unless something comes up that prevents me from doing an analysis in the morning. The office is generally closed on Tue. and Sun. I will be out of the office on Mon. MAY 5 for car service and Sat., MAY 17 for an all day church event. IF I’m back early enough on Mon., I will attempt and update.
The Storm Prediction Center (SPC) has issued a ENHANCED risk for severe thunderstorms in the current DAY 1 Outlook: FROM CENTRAL/EAST TEXAS TO THE LOWER MISSISSIPPI VALLEY AND TENNESSEE VALLEY…
…SPC SUMMARY…
Widespread strong thunderstorm development is expected from parts of central and eastern Texas to the lower Mississippi and Tennessee Valleys, and into the Cumberland Plateau by evening. This includes potential for large hail and damaging wind gusts.
SPC DAY 1 SEVERE THUNDERSTORM OUTLOOK (LINKED)
TORNADO PROBABILITY
Probability of a tornado within 25 miles of a point.
HAIL PROBABILITY
Probability of one inch diameter hail or larger within 25 miles of a point. Hatched Area: 10% or greater probability of two inch diameter hail or larger within 25 miles of a point
DAMAGING THUNDERSTORM WIND PROBABILITY
Probability of damaging thunderstorm winds or wind gusts of 50 knots or higher within 25 miles of a point.
The following is the current CSU – MLP severe weather forecast map:
CSU – MLP DAY 1 FORECAST (CLICK FOR LARGER IMAGE)
RIVER FLOOD OUTLOOK (LINKED)
EXCESSIVE RAINFALL FORECAST DAY 1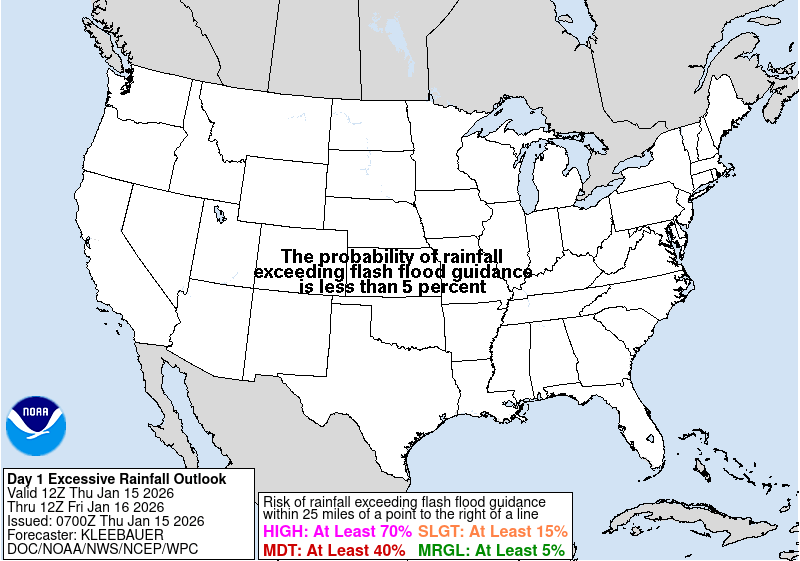

DAY 1 PROBABILITY CONVERSION TABLE
SPC DISCUSSION
…Southern Plains to Lower Mississippi Valley/Tennessee Valley…
A residual MCS, (Mesoscale Convective System) with diminished intensity since early on the overnight, persists at daybreak along the Red River and Texas/Oklahoma border region eastward into the Mid-South largely paralleling I-40, with a probable related MCV (Mesoscale Convective Vortex) across eastern Oklahoma. A relatively isolated severe potential will initially exist with these storms this morning. However, an intensification of related/downstream storms is expected by midday, potentially spanning parts of Arkansas into western/Middle Tennessee, western Kentucky, and northern Alabama. Additional severe storm development will be possible this afternoon northeastward into the middle Ohio Valley and toward the Cumberland Plateau, as increasing low-level/deep-layer southwesterly winds overlie a moderately unstable boundary layer. Multiple organizing storm clusters can be expected regionally this afternoon into evening.
Farther southwest across central/eastern Texas, while considerable drying and stabilization is still apparent in observational data after last evening’s MCS, the air mass should steadily recover with moistening and relatively aggressive destabilization into peak heating. Initial thunderstorm development will be accompanied by the potential for large hail, with supercells capable of very large hail possible especially with west-southwestward extent into the Edwards Plateau and toward the Rio Grande. Damaging wind potential will also increase as convection organizes and spreads southeastward into this evening across central/southeast Texas, and possibly Deep South Texas tonight.
The following maps indicate the probability for tornadoes. The NADOCAST site was not accessible. The following is the forecast from the SPC calibrated HREF / GEFS MODEL 00Z run
00Z CALIBRATED HREF / GEFS TORNADO PROBABILITY ( 4:00 P.M. CDT – 6:00 P.M. CDT)


Based on my analysis of the severe weather indices, the forecast calls for a MODERATELY unstable atmosphere for the OHIO and Tennessee Valley region and a VERY unstable to EXTREMELY unstable atmosphere where indices are maximum. Indices indicate all severe threats are probable, with the main severe threat in the form of large hail (up to 2 – 3 inches in diameter) and damaging thunderstorm winds within the appropriate outlined areas, followed by a lower tornado threat, albeit tornadoes appear likely. While the maximum EHI value indicates tornadoes approaching EF2 – EF3 intensity, based on the low Storm Relative Helicity, I currently do not expect tornadoes of this intensity. Based on analysis of model animations and the current outlook, strong storm initiation should occur around approximately 1:00 P.M. CDT, with the strongest cells occurring between approximately 1:00 P.M. CDT – through 4:00 – 6:00 P.M. CDT.
Regarding the severe indices and EHI values for this synopsis, the minimum value will represent indices in the portion of the ENHANCED risk outline for the Ohio and Tennessee Valley, with the maximum values over Texas within the SIGNIFICANT HATCHED hail risk area.
Indices were analyzed from the NAM 3KM, HRRR 3KM, CIPS DETERMINISTIC, and SPC SREF model guidance.
The following were the forecast parameters and indices analyzed this morning. Bear in mind, indices recorded below are for the time of peak intensity. Some indices meanings are posted below the indices themselves, and the NWS page containing a more extensive explanation can be accessed further on in the synopsis:
SBCAPE: 2000 – 4500 j/kg-1
MLCAPE: 2000 – 3000 j/kg-1
MUCAPE: 2500 – 4500 j/kg-1
SRH 0 -1 km: 50 – 100 m2/s2
SRH 0 -3 km: 100 – 200 m2/s2
SRH EFFECTIVE: 100 – 200 m2/s2
L. I.: -4 to -9
SCP: 2 – 8
STP: 0.2 – 1.8
0 -6 km SHEAR: 40 kts – 50 kts
EFF. SHEAR: 35 kts – 40 kts
MID LEVEL LAPSE RATE: 7.0C – 8.5C
DEWPOINT: 60F – 66F
EHI: 1.9 – 2.8
TOTAL TOTALS INDEX: 52C – 57C
K INDEX: 24C – 30C (OH. / TN. VALLEY) 28C – 33C (TX.)
SWEAT INDEX: 325 – 350 (OH. / TN. VALLEY) 475 – 500 (TX.)
THOMPSON INDEX: 28 – 42
CRAVEN – BROOKS INDEX: 30,000 – 60,000
CAPE 
ENERGY HELICITY INDEX
K INDEX
TOTAL TOTALS INDEX
STORM RELATIVE HELICITY
LIFTED INDEX
SWEAT VALUES
THOMPSON INDEX
Craven SigSvr Parameter:
The simple product of 100mb MLCAPE and 0-6km magnitude of the vector difference (m/s; often referred to as “deep layer shear”) accounts for the compensation between instability and shear magnitude. Using a database of about 60,000 soundings, the majority of significant severe events (2+ inch hail, 65+ knot winds, F2+ tornadoes) occur when the product exceeds 20,000 m3/s3.
A little fact on SRH values and tornadoes from NOAA / NWS
A little fact on SRH values and tornadoes from NOAA / NWS
Storm Relative Helicity (m2 s-2)
SRH (Storm Relative Helicity) is a measure of the potential for cyclonic updraft rotation in right-moving supercells, and is calculated for the lowest 1-km and 3-km layers above ground level. There is no clear threshold value for SRH when forecasting supercells, since the formation of supercells appears to be related more strongly to the deeper layer vertical shear. Larger values of 0-3-km SRH (greater than 250 m2 s-2) and 0-1-km SRH (greater than 100 m2 s-2), however, do suggest an increased threat of tornadoes with supercells. For SRH, larger values are generally better, but there are no clear thresholds between non-tornadic and significant tornadic supercells.
STP ( Significant Tornado Parameter) EXPLAINED:
A majority of significant tornadoes (EF2 or greater damage) have been associated with STP values greater than 1, while most non-tornadic supercells have been associated with values less than 1 in a large sample of RAP analysis proximity soundings.
SCP (Supercell Composite Parameter) EXPLAINED:
A multiple ingredient, composite index that includes effective storm-relative helicity (ESRH, based on Bunkers right supercell motion), most unstable parcel CAPE (muCAPE) and convective inhibition (muCIN), and effective bulk wind difference (EBWD). Each ingredient is normalized to supercell “threshold” values, and larger values of SCP denote greater “overlap” in the three supercell ingredients. Only positive values of SCP are displayed, which correspond to environments favoring right-moving (cyclonic) supercells.
The following are the SCP (Supercell Composite Parameter) and STP (Significant Tornado Parameter) forecast maps from the NAM 3KM and HRRR 3KM model. Generally, the higher the values and brighter the color, indicates a greater probability of strong thunderstorm and / or tornadic activity over an area:
NAM 3KM SCP FORECAST 1:00 P.M. CDT MAY 02 – 10:00 P.M. CDT MAY 02
NAM 3KM STP FORECAST 1:00 P.M. CDT MAY 02 – 10:00 P.M. CDT MAY 02
HRRR 3KM SCP FORECAST 1:00 P.M. CDT MAY 02 – 10:00 P.M. CDT MAY 02
HRRR 3KM STP FORECAST 1:00 P.M. CDT MAY 02 – 10:00 P.M. CDT MAY 02
Please use the following maps, which should update automatically, for Mesoscale Discussions and Convective Watches. You may have to refresh your browser, or click on the graphics. I have provided the SPC homepage link below, so you may get the updated information regarding any changes to the outlook:
https://www.spc.noaa.gov/classic.html
SPC MESOSCALE DISCUSSIONS (CLICK IMAGE FOR UPDATES)
SPC CONVECTIVE WATCHES (CLICK IMAGE FOR UPDATES)
IF A TORNADO WARNING IS ISSUED FOR YOUR AREA, IMMEDIATELY TAKE STURDY AND SAFE SHELTER
The following sites will explain most of the severe weather and tornado values listed above, and will give you an idea of what to expect:
ENVIRONMENTAL INDICES AND PARAMETERS NWS
https://www.weather.gov/lmk/indices
THE WEATHER PREDICTION
http://www.theweatherprediction.com/severe/indices/
The following NWS Watch / Warning map will provide local NWS information for your area. Click the image, then once it refreshes, click on your area of interest to view any special weather statements, hazards or advisories for your area.
NWS WATCH / WARNING DISPLAY (LINKED…CLICK MAP, THEN YOUR AREA)
NWS DOPPLER RADAR LOOP (LINKED, CLICK RADAR MAP)
RAP RADAR (CLICK IMAGE THEN GO TO LOOP DURATION AND PICK LENGTH OF LOOP, THEN CLICK RADAR SITE)
CARIBBEAN RADAR (CLICK IMAGE TO ACCESS ANIMATION)
You may direct any questions by contacting me personally, ANYTIME, at: [email protected]
Have a blessed day!
T. F. “STORM” WALSH III
GMCS, USCG (ret)
METEOROLOGIST / HURRICANE SPECIALIST /SEVERE WEATHER SPECIALIST


 English (US) ·
  French (CA) ·