
 11 hours ago
3
11 hours ago
3
PROTECT YOUR DNA WITH QUANTUM TECHNOLOGY
Orgo-Life the new way to the future Advertising by AdpathwayDisclaimer: This site is not affiliated with the National Hurricane Center, Hurricane Hunters, Storm Prediction Center, or National Weather Service. ALL forecasts herein are the result of my analysis, (to which you will see me at times, insert excerpts from various agencies due to the nature of the importance of the information) and I am solely responsible for the content. As ALWAYS, follow the National Hurricane Center, National Weather Service, and your local Emergency Management officials for emergency decisions. In addition, this is strictly a FORECAST OFFICE. I CANNOT make decisions regarding travel plans, etc. My purpose, is to provide you the information, based solely on information I analyze, and the accuracy of the information at hand of the time of analysis, so you may make informed decisions.
(T. F. “Storm” Walsh)
For those who have donated to my site, your help has been greatly appreciated. If you are not aware, donations to my site help pay for subscriptions to sites I use as well as software updates, which provide all the models and information used in my forecasts. To donate, please click the DONATE button to the right side of the page, or on the graphic of the dog. Any help you provide is immensely appreciated!
DONATIONS ACCEPTED AND APPRECIATED


I will reiterate, my forecasts are based on the available information at the time of analysis, and are only as accurate as the information analyzed and the solutions provided.
Good day everyone!
PLEASE keep the residents of Texas in your prayers regarding the terrible flash flooding tragedy and those lost.
I know some of my forecasts are LONG, however if you read in the entirety, you’ll have the full lowdown.
I will be out of the office on Wednesday, Aug. 27 to celebrate my birthday, and intend to resume forecasting on Thursday the 28th
STORM W 2025 SEASON FORECAST
TOTAL NAMED STORMS: 15 – 17
TOTAL HURRICANES: 7 – 8
MAJOR HURRICANES: 2 – 3
AVERAGE HURRICANE SEASON:
TOTAL NAMED STORMS: 14
TOTAL HURRICANES: 7
MAJOR HURRICANES: 3
CSU (Dr. Phil Klotzbach) UPDATED SEASONAL FORECAST
TOTAL NAMED STORMS: 16
TOTAL HURRICANES: 8
MAJOR HURRICANES: 3
2025 HURRICANE SEASON TOTALS
TOTAL NAMED STORMS: 5
TOTAL HURRICANES: 1
MAJOR HURRICANES: 1
The following is the list of storm names for the 2025 Atlantic Hurricane Season:
Andrea Barry Chantal Dexter Erin Fernand Gabrielle Humberto Imelda Jerry
Karen Lorenzo Melissa Nestor Olga Pablo Rebekah Sebastien Tanya Van Wendy
As we go through the season and storms are named, I will mark them in RED to indicate active, or already named systems.
Please use the following links for severe weather information:
SPC HOMEPAGE LINK
https://www.spc.noaa.gov/classic.html
NADOCAST
http://data.nadocast.com/
ATLANTIC IR AND WV LOOP IMAGERY

Africa satellite loop imagery shows another wave exiting Africa, and diminishing activity
MTG-I1 AFRICA SATELLITE IMAGE
ERIN has transitioned to extratropical, with the center having become exposed to the SW. As of the 11:00 a.m. EDT advisory from the NHC, the following was available on ERIN:
11:00 AM EDT Wed Aug 20
Location: 38.8°N; 63.1°W
Moving: ENE at 28 mph
Min pressure: 956 mb / 28.23 in.
Max sustained: 90 mph
ERIN SATELLITE LOOP
Watches and warnings have been discontinued, as well as graphics from the HURRTRACK APP.
PUBLIC ADVISORY LINK
https://www.nhc.noaa.gov/text/refresh/MIATCPAT5+shtml/211443.shtml?
AVISO PUBLICO
https://www.nhc.noaa.gov/text/refresh/MIATASAT5+shtml/211444.shtml?
NHC KEY MESSAGES

I HIGHLY RECOMMEND READING THE FOLLOWING BRIEFING ON ERIN from the NWS office from Newport / Morehead City, NC., and NWS Wakefield, VA. Click the link.
https://www.weather.gov/media/mhx/LatestBriefing.pdf
https://www.weather.gov/media/akq/briefings/LatestBriefing.pdf
RIP CURRENTS

ERIN is currently moving toward the ENE. Based on analysis of the current steering layer, and forecast steering maps, ERIN should continue a track as depicted in current guidance, and continue out to sea. Based on this, I agree with the 12Z track guidance, and am in line with the TVCA model and NHC forecast track.
ERIN 12Z TRACK GUIDANCE (LINKED FOR LARGER IMAGE)

NHC FORECAST MAP
Based on the transition to an extratropical cyclone, ERIN will now become under the influence of a baroclininc environment. ERIN should continue to weaken in the short term, however as the environment becomes more baroclinic, interaction with a mid level trough this weekend should cause ERIN to become larger and intensify once again for a very brief period. Based on these forecast conditions, I agree with the NHC intensity forecast.
NHC INTENSITY FORECAST
CIMSS ADT WIND RADII
This will be my final update on ERIN.
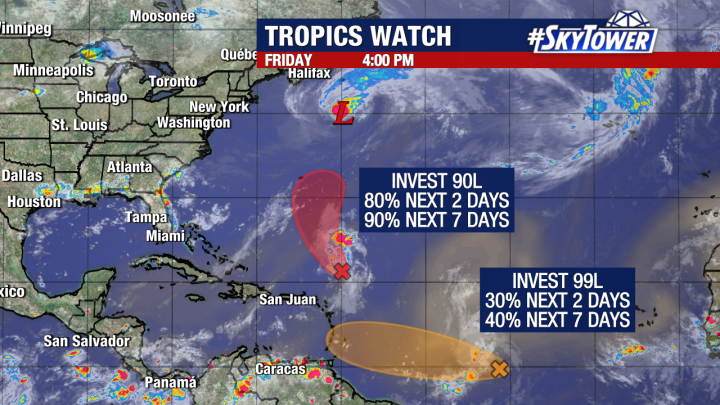
Elsewhere, the NHC has designated a HIGH (90%) probability for development of INVEST 90L during the next 7 days. The ECMWF EPS probability is indicating a 75% probability:
NHC 7 DAY GTWO (LINKED)
ECMWF EPS CYCLONE FORMATION PROBABILITY FORECAST 24 – 72 HOURS
As of the update, the following information was available from the ATCF BTK file for 12Z.
8:00 AM EDT Thu Aug 21
Location: 20.0°N; 59.6°W
Moving: NW at 15 mph
Min pressure: 1011mb / 29.85 in.
Max sustained: 30 mph
The INVEST is moving toward the NW and should continue on this motion for the next 24 – 36 hours. Based on analysis of current forecast steering layers maps, 90L should continue through the weakness in the subtropical ridge, and eventually turn more toward the north in about 48 hours. I prefer the TVCA consensus track.
12Z TRACK GUIDANCE

Currently, while models indicate conditions are marginal for very slow development, real time analysis indicates the system is under 20 kts of wind shear, and in a surrounding drier environment based on water vapor imagery.
Forecast wind shear analysis indicates a radial shear pattern may develop in about 48 hours, with SHIPS diagnostics indicating shear to lessen to single digit values. An improvement in precipitable water and mid level humidity is also forecast within that timeframe by the global models. While these forecast conditions indicate a depression could possibly develop this weekend, I am somewhat skeptical, as there are 2 things that have to occur…it must mix out and fight off the drier air, and it still has to develop a well defined and closed low level circulation.
INVEST 90L SATELLITE LOOP
MULTIPLATFORM SATELLITE SURFACE WIND ANALYSIS
I will continue to monitor this system very closely during the next 72 hours.
Elsewhere, the NHC has assigned a MEDIUM (50%) probability for development during the next 7 days for INVEST 99L, and the ECMWF EPS shows a quick decline in the probability after 72 hours, in the graphic posted earlier in this forecast
NHC 7 DAY GTWO LINKED
Current satellite loop imagery indicates 99L looks less organized than a day ago, and may be due to 20 kts of southerly shear, and some slight dry air intrusion. Based on the most recent wind analysis, 99L still lacks a defined, closed surface low. TPW and mid level relative humidity values are limited, and are forecast to decrease during the next 48 hours. Based on the SHIPS diagnostic forecast, and analysis of the global models, shear is forecast to decrease after the next 48 hours, and TPW and mid level humidity values are forecast to increase to somewhat favorable levels as INVEST 99L approaches and possibly enters the Caribbean Sea. This could possibly lead to some brief development, however since I’ve noticed in all of this analysis I’ve been doing over the past week, models have been slightly off on forecast conditions with this and 90L. The majority of intensity models do not bring this to Tropical Storm intensity. So, development, if any, is all going to hinge on just how exactly forecast conditions pan out.
INVEST 99L SATELLITE LOOP
MULTIPLATFORM SATELLITE SURFACE WIND ANALYSIS
This system is currently moving toward the WSW. As of the 12Z ATCF BTK update, the following was available on INVEST 99L:
8:00 AM EDT Tue Aug 19
Location: 10.1°N; 40.2°W
Moving: W at 12 mph
Min pressure: 1011 mb / 29.85 in.
Max sustained: 35 mph
INVEST 99L initial motion is west (265 degrees). Based on analysis of current and forecast steering layers maps, this should continue for the next 48 – 72 hours, with fluctuations to the WNW and back to W. Based on this, I agree with track guidance and currently prefer the TVCA consensus model.
12Z TRACK GUIDANCE (LINKED FOR LARGER IMAGE)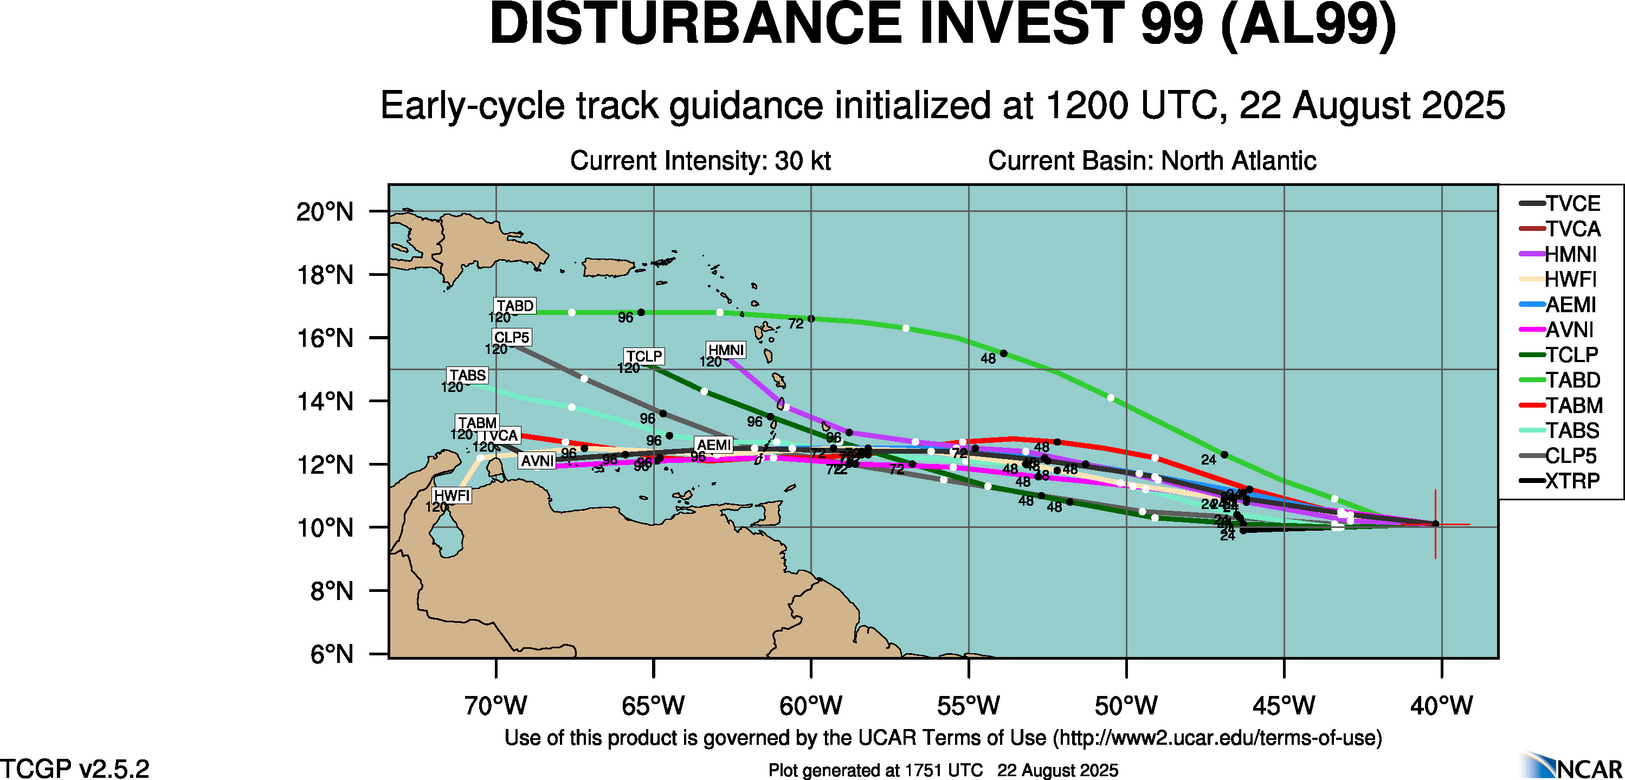

I will continue to monitor this system during the next 48 hours for any changes to the forecast.
Elsewhere, I am not expecting any development for the next 5 – 7 days.
I didn’t wish to make this any longer, however I wanted to provide a kind of a heads up for the season as we come into the end of Aug., and enter Sept. The MJO is heading into phase 4, and this may explain the current decrease in wave activity over Africa. While this phase is not particularly active, you’ll note a very small area in the NW Gulf. Development can sometimes occur there in phase 4. Additionally, you will notice in the temperature anomaly animation, a good cool down is forecast over the northern and eastern portion of the U.S. during this last week of Aug. This has a tendency to produce forced convergence / max. net lift in the atmosphere as the SST anomalies are warmer than the surrounding landmass, creating rising motion. Unfortunately, this would be over the Gulf and SE coastal waters. IF conditions are favorable, one cannot rule out a development possibility, especially if current 99L develops a surface circulation, and possibly enters the Gulf as a weak entity.
ECMWF TEMPERATURE ANOMALIES ANIMATION
MJO FORECAST ACCESS – S2
ECMWF EXTENDED
MJO PHASE 4 OBSERVED DEVELOPMENT
As we get into about the 5th day of Sept., The MJO is forecast to swing back into a phase 1 and phase 2 situation, with the majority of the ensemble members indicating this. IF the same temperature pattern holds, Sept. could become very active, especially if the week 3 and 4 MJO pattern comes to fruition.
JMA MJO PATTERN CHI200 ANOMALIES FORECAST SEP. 06 – SEP 19
The following links will connect you to the Excessive Rainfall probabilities and River Flood Outlook:
EXCESSIVE RAINFALL
https://www.wpc.ncep.noaa.gov/qpf/excessive_rainfall_outlook_ero.php
SIGNIFICANT RIVER FLOOD OUTLOOK
https://www.wpc.ncep.noaa.gov/nationalfloodoutlook/index.html
The following NWS Watch / Warning map will provide local NWS information for your area. Click the image, then once it refreshes, click on your area of interest to view any special weather statements, hazards or advisories for your area.
NWS WATCH / WARNING DISPLAY (LINKED…CLICK MAP, THEN YOUR AREA)
NWS DOPPLER RADAR LOOP (LINKED, CLICK RADAR MAP)
RAP RADAR (CLICK IMAGE THEN GO TO LOOP DURATION AND PICK LENGTH OF LOOP, THEN CLICK RADAR SITE)
CARIBBEAN RADAR (CLICK IMAGE TO ACCESS ANIMATION)
You may direct any questions by contacting me personally, ANYTIME, at: [email protected]
Have a blessed day!
T. F. “STORM” WALSH III GMCS, USCG (ret)
METEOROLOGIST / HURRICANE SPECIALIST /SEVERE WEATHER SPECIALIST
MEMBER WEST CENTRAL FLORIDA AMS


 English (US) ·
  French (CA) ·