

 14 hours ago
2
14 hours ago
2
PROTECT YOUR DNA WITH QUANTUM TECHNOLOGY
Orgo-Life the new way to the future Advertising by AdpathwayAuthors: Francesca Mancini, Claire Carvell and the PoMS partnership
Our new paper “Modelling pollinator trends using multi-scale environmental data from the UK Pollinator Monitoring Scheme”, recently published in Ecological Solutions and Evidence, represents an important milestone for the UK Pollinator Monitoring Scheme (PoMS). Established in 2017, PoMS was designed to fill a critical evidence gap by collecting standardised data on bees, hoverflies and other flower-visiting insects across a wide range of habitats. The analyses in the paper were based on the first six years of PoMS data, but we are now close to having a ten-year time series, making this one of the longest and most comprehensive standardised pollinator monitoring datasets available in Europe.
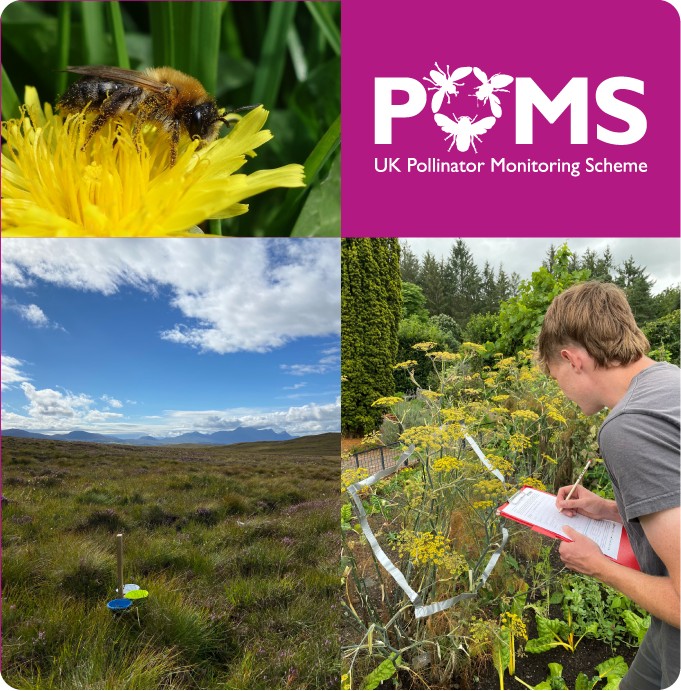 © UK Pollinator Monitoring Scheme
PoMS combines three complementary surveys: pan trap sampling and 10-minute Flower-Insect Timed Counts (FIT Counts) both carried out on a nationally representative network of 75 1 km survey squares, together with a wider network of thousands of FIT Counts submitted by citizen scientists in self-selected locations nationwide. Together, these surveys provide information on insect abundance, species richness (of bees and hoverflies from the pan traps) and flower visitation across a broad range of UK habitats and pollinator groups.
Insects are highly responsive to environmental conditions, making it difficult to distinguish genuine population change from short-term fluctuations. When designing the surveys, the PoMS partnership therefore included collection of local-scale data describing both weather conditions and the availability of floral resources at the survey location, in the hope that these environmental variables could help explain some of the observed variation in insect populations. One of the goals of our paper was to explore how this environmental information could be used to improve estimates of pollinator trends. To address this, we compared a series of statistical models with increasing levels of complexity. Some models only accounted for survey year, month and site effects, similar to approaches used in other long-term monitoring schemes. Others also accounted for environmental factors measured at multiple scales, including differences in habitats and landscapes, changes in temperature from year to year, the availability of flowers, and local weather conditions during the surveys.
Models that incorporated environmental information provided the best fit to the data, suggesting that both large-scale environmental variables and local survey conditions help explain variation in pollinator counts. At the same time, the overall direction and magnitude of inferred trends were generally robust across our modelling approaches. This is encouraging because it suggests that the PoMS results reflect real changes in insect numbers rather than artefacts of analysis.
Developing Official Statistics
The modelling framework developed and tested in our paper directly supports the production of the Official Statistics on pollinating insect trends, published for the first time this year by JNCC and UKCEH. These statistics use PoMS data to generate annual indicators describing how the abundance and species richness of different pollinator groups may be changing through time. The Official Statistics extend the analysis beyond the period covered in the paper and currently use PoMS data collected between 2017 and 2024, encompassing surveys from nearly 3,500 sites across Great Britain.
The Official Statistics reveal a mixed picture, similar to the trend results presented in the paper. The most consistent result is for hoverflies, which showed substantial declines across surveys. This finding is particularly noteworthy given the crucial role hoverflies play as pollinators and providers of natural pest control. For other groups, the picture is more nuanced, with some showing different trends in the 1 km survey network and the public FIT Counts. These differences suggest that pollinator trends may vary substantially among habitats. For example, public FIT Counts are dominated by garden and urban sites, whereas the 1 km survey network primarily samples agricultural and semi-natural habitats. Understanding these differences is one of the key scientific questions emerging from the PoMS dataset.
The Official Statistics published this year from the PoMS data are still “in development”, reflecting both the novelty of the dataset and the opportunities for further methodological improvement. The PoMS time series is still young by biodiversity monitoring standards, but each additional year of data increases our ability to detect long-term change and separate true trends from short-term fluctuations.
PoMS was established to provide the long-term evidence needed to understand how pollinator populations are changing and why. Nine years into the scheme, we are beginning to see the power of that investment. Thanks to the dedication of thousands of volunteers, taxonomists and partner organisations, PoMS is now delivering not only scientific insights and open data but also the evidence required for official statistics and biodiversity reporting. The coming years promise an even richer picture of pollinator trends across the UK.
Read the full article ‘Modelling pollinator trends using multi-scale environmental data from the UK Pollinator Monitoring Scheme’ in Ecological Solutions and Evidence.




















 English (US) ·
  French (CA) ·