
 7 hours ago
2
7 hours ago
2
PROTECT YOUR DNA WITH QUANTUM TECHNOLOGY
Orgo-Life the new way to the future Advertising by AdpathwayDisclaimer: This site is not affiliated with the National Hurricane Center, Hurricane Hunters, Storm Prediction Center, or National Weather Service. ALL forecasts herein are the result of my analysis, (to which you will see me at times, insert excerpts from various agencies due to the nature of the importance of the information) and I am solely responsible for the content. As ALWAYS, follow the National Hurricane Center, National Weather Service, and your local Emergency Management officials for emergency decisions. In addition, this is strictly a FORECAST OFFICE. I CANNOT make decisions regarding travel plans, etc. My purpose, is to provide you the information, based solely on information I analyze, and the accuracy of the information at hand of the time of analysis, so you may make informed decisions.
(T. F. “Storm” Walsh)
For those who have donated to my site, your help has been greatly appreciated. If you are not aware, donations to my site help pay for subscriptions to sites I use as well as software updates, which provide all the models and information used in my forecasts. To donate, please click the DONATE button to the right side of the page, or on the graphic of the dog. Any help you provide is immensely appreciated!
DONATIONS ACCEPTED AND APPRECIATED


I will reiterate, my forecasts are based on the available information at the time of analysis, and are only as accurate as the information analyzed and the solutions provided.
Good day everyone!
PLEASE keep the residents of Texas in your prayers regarding the terrible flash flooding tragedy and those lost, and for the children and parents in MN.
I know some of my forecasts are LONG, however if you them in their entirety, you’ll have the full lowdown.
STORM W 2025 SEASON FORECAST
TOTAL NAMED STORMS: 15 – 17
TOTAL HURRICANES: 7 – 8
MAJOR HURRICANES: 2 – 3
AVERAGE HURRICANE SEASON:
TOTAL NAMED STORMS: 14
TOTAL HURRICANES: 7
MAJOR HURRICANES: 3
CSU (Dr. Phil Klotzbach) UPDATED SEASONAL FORECAST
TOTAL NAMED STORMS: 16
TOTAL HURRICANES: 8
MAJOR HURRICANES: 3
2025 HURRICANE SEASON TOTALS
TOTAL NAMED STORMS: 6
TOTAL HURRICANES: 1
MAJOR HURRICANES: 1
The following is the list of storm names for the 2025 Atlantic Hurricane Season:
Andrea Barry Chantal Dexter Erin Fernand Gabrielle Humberto Imelda Jerry
Karen Lorenzo Melissa Nestor Olga Pablo Rebekah Sebastien Tanya Van Wendy
As we go through the season and storms are named, I will mark them in RED to indicate active, or already named systems.
Please use the following links for severe weather information:
SPC HOMEPAGE LINK
https://www.spc.noaa.gov/classic.html
NADOCAST
http://data.nadocast.com/
The following is an article from Dr. Phil Klotzbach from CSU, explaining the quiet conditions over the Atlantic thus far and what he expects for the remainder of the season: https://tropical.colostate.edu/Forecast/2025_0909_seasondiscussion.pdf
ATLANTIC IR AND WV LOOP IMAGERY

MTG-I1 AFRICA SATELLITE IMAGE
Not much change in the Atlantic. A good amount of dry air still persists over much of the Atlantic basin with the SAL still persistent, noted in pink. You’ll note in the African satellite image, limited tropical wave activity (yellow circles) with the red circle indicating the wave I am monitoring, and an increase in moisture in the water vapor loop imagery, over W. Africa. This may possibly be due to the MJO having entered weak into phase 2. Regarding the drier air, Dr. Klotzbach explains why it is occurring…The TUTT (Tropical Upper Tropospheric Trough), and a strong Azores – Bermuda high. I also did a short analysis on this, and the 200 mb forecast map indicates that near months end, the TUTT will lift, and winds at the 200 mb level will become zonal over the subtropics. The A/B high has been running at around 1028 – 1030 mb, aiding in dust transport. The average pressure for this is 1024 mb. Near months end, the forecast calls for the A/B high to weaken to around 1020 mb. Based on the forecast of these 2 features, we SHOULD see a reduction in dry air.
GOES 19 RGB DUST SATELLITE 

I continue to monitor the tropical wave that has exited the African coast. The NHC has designated a MEDIUM (40%) probability for cyclone development during the next 7 days. The recent ECMWF EPS Cyclone Formation Probability forecast indicates a 60% probability from 72 – 120 hours.
NHC 7 DAY GTWO (LINKED)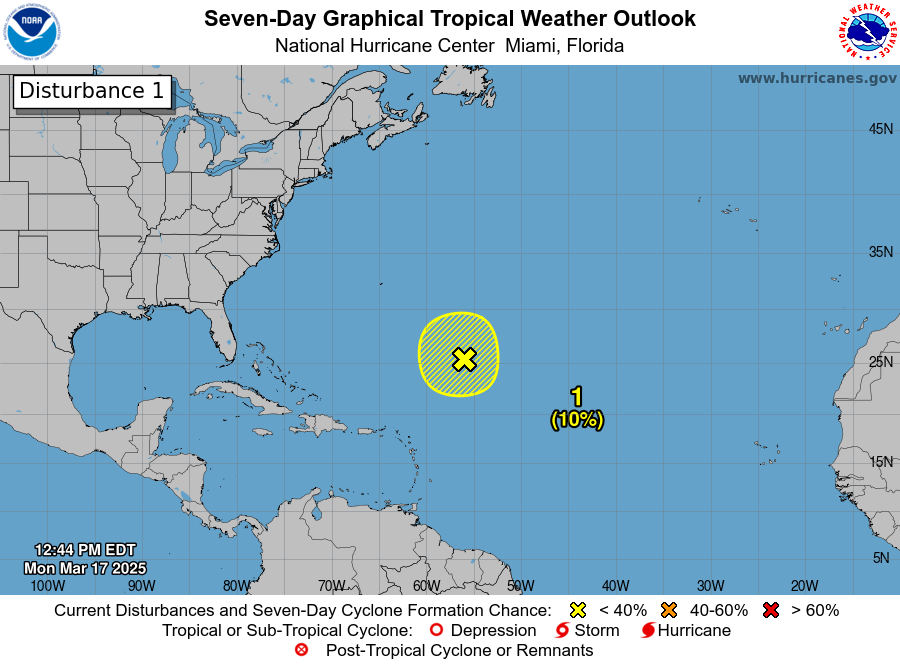
ECMWF EPS CYCLONE FORMATION PROBABILITY FORECAST 72 – 120 HOURS

Based on analysis this morning, the wave is still under 5 – 10 kts of easterly shear. Based on my analysis of the ECMWF global model, conditions are forecast to slowly improve, with the exception of the mid level moisture based on the 500 mb relative humidity forecast indicating only marginal RH values. The shear forecast indicates shear to reduce at around 72 hours in the forecast period, with development of a radial shear pattern. Given these factors, I do believe this wave will continue to develop, however it will be a slow process, and development of a tropical depression may not occur until approximately 96 – 120 hours in the forecast period. Close up analysis of visible satellite loop imagery indicated the center of the wave was located approximately near 13.5N;21.3W, and this may be off, as the circulation is somewhat broad at the moment. Based on analysis of the forecast pressure pattern, this COULD be another out to sea scenario, however I am not going to speculate or get into this, until the area is designated an INVEST and guidance models begin running.
CURRENT EATL SATELLITE LOOP

ECMWF MSLP ANOMALY FORECAST 72 HOURS
ECMWF PRECIPITABLE WATER FORECAST
ECMWF 500 MB RELATIVE HUMIDITY FORECAST
ECMWF WIND SHEAR FORECAST
Elsewhere, and area of disturbed weather is noted over central America, and is associated with the CAG (Central American Gyre).
CENTRAL AMERICA SATELLITE LOOP
On a forecast map, the CAG is located at 850 mb. Based on analysis of the 850 mb animation, this disturbed weather should remain in the EPAC.
The following is the current phase and MJO forecast per the phase space diagrams. Will this actually occur? Hard to say, but these phase space diagrams have been doing a decent job this season, and the CHI200 anomaly forecast has been consistent in indicating phases 8, 1, and 2 of the MJO. We will have to pay attention to this, especially as we get later into Sep. and into Oct. as the CAG (Central American Gyre) should begin to come back into play. I have posted two articles regarding the CAG. IF the current MJO forecast comes true, we could possibly see the same uptick we noted last season, during a 2 – 3 week period. I will have the link to two MJO articles posted, following the graphics.
INITIAL AND MJO FORECAST ACCESS – S2 MODEL

ECMWF MJO PHASE SPACE DIAGRAM FORECAST
The following maps are from the updated JMA CHI200 anomalies forecast, indicating favorable phase 1 and phase 2 conditions in forecast maps 2 and 3. The upward motion in blue for forecast map 1, would indicate as to why we have an increase in activity in the EPAC recently.
SEP. 13 – SEP. 19
SEP. 20 – SEP. 26
SEP. 27 – OCT. 10
The following is from the GFS which indicates upward motion of the MJO in blue and purple:
GFS RAIN RATE AND 200 MB VELOCITY POTENTIAL FORECAST FOR SEP. 19
The following maps indicate tropical cyclone density (development) in relation to the MJO phases, with model forecasts located on the right, and actual observations located on the left:
DEVELOPMENT CORRELATION (DEPICTED BY ORANGE AND RED)

MJO ARTICLES
https://journals.ametsoc.org/view/journals/clim/23/2/2009jcli2978.1.xml
https://agupubs.onlinelibrary.wiley.com/doi/full/10.1029/2023GL106872
CENTRAL AMERICAN GYRE INFORMATION (CLICK LINKS BELOW)
https://en.wikipedia.org/wiki/Central_American_gyre
https://journals.ametsoc.org/view/journals/mwre/145/5/mwr-d-16-0411.1.xml
The following links will connect you to the Excessive Rainfall probabilities and River Flood Outlook:
EXCESSIVE RAINFALL
https://www.wpc.ncep.noaa.gov/qpf/excessive_rainfall_outlook_ero.php
SIGNIFICANT RIVER FLOOD OUTLOOK
https://www.wpc.ncep.noaa.gov/nationalfloodoutlook/index.html
The following NWS Watch / Warning map will provide local NWS information for your area. Click the image, then once it refreshes, click on your area of interest to view any special weather statements, hazards or advisories for your area.
NWS WATCH / WARNING DISPLAY (LINKED…CLICK MAP, THEN YOUR AREA)
NWS DOPPLER RADAR LOOP (LINKED, CLICK RADAR MAP)
RAP RADAR (CLICK IMAGE THEN GO TO LOOP DURATION AND PICK LENGTH OF LOOP, THEN CLICK RADAR SITE)
CARIBBEAN RADAR (CLICK IMAGE TO ACCESS ANIMATION)
You may direct any questions by contacting me personally, ANYTIME, at: [email protected]
Have a blessed day!
T. F. “STORM” WALSH III GMCS, USCG (ret)
METEOROLOGIST / HURRICANE SPECIALIST /SEVERE WEATHER SPECIALIST
MEMBER WEST CENTRAL FLORIDA AMS


 English (US) ·
  French (CA) ·