
 1 month ago
95
1 month ago
95
PROTECT YOUR DNA WITH QUANTUM TECHNOLOGY
Orgo-Life the new way to the future Advertising by AdpathwayDisclaimer: This site is not affiliated with the National Hurricane Center, Hurricane Hunters, Storm Prediction Center, or National Weather Service. ALL forecasts herein are the result of my analysis, (to which you will see me at times, insert excerpts from various agencies due to the nature of the importance of the information) and I am solely responsible for the content. As ALWAYS, follow the National Hurricane Center, National Weather Service, and your local Emergency Management officials for emergency decisions. In addition, this is strictly a FORECAST OFFICE. I CANNOT make decisions regarding travel plans, etc. My purpose, is to provide you the information, based solely on information I analyze, and the accuracy of the information at hand of the time of analysis, so you may make informed decisions.
(T. F. “Storm” Walsh)
For those who have donated to my site, your help has been greatly appreciated. If you are not aware, donations to my site help pay for subscriptions to sites I use as well as software updates, which provide all the models and information used in my forecasts. To donate, please click the DONATE button to the right side of the page, or on the graphic of the dog. Any help you provide is immensely appreciated!
DONATIONS ACCEPTED AND APPRECIATED


I will reiterate, my forecasts are based on the available information at the time of analysis, and are only as accurate as the information analyzed and the solutions provided.
Good day everyone!
I have a medical appt. on Thu. morning. I will try to issue the severe outlook when I return, IF it can be issued prior to initiation of the severe weather. If not, I intend to follow up with a tropical outlook.
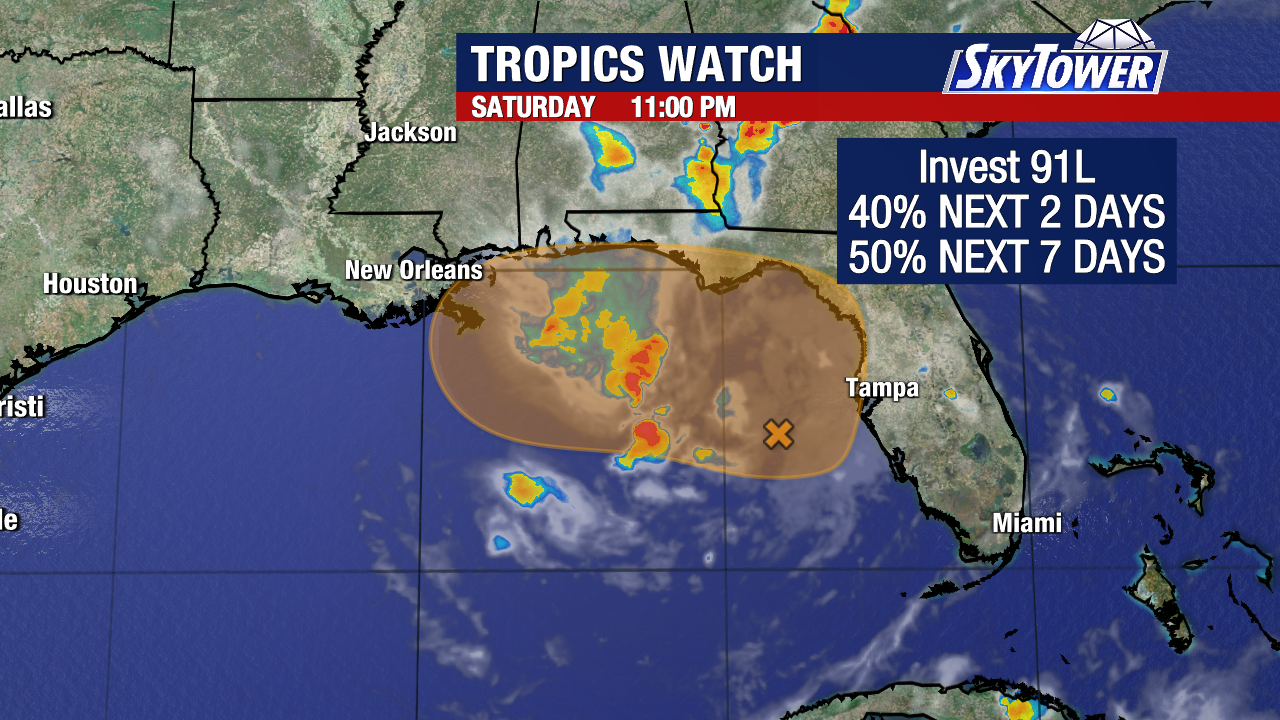
Tropical Cyclone formation is not expected during the next 5 – 7 days.
Again, regarding issuance of tropical updates and severe weather updates, severe weather updates will be posted for SLIGHT risk and above outlines. Once we begin seeing probabilities for possible tropical development, or we get a developing system, the tropical weather update will take precedence.
The forecast center is closed on Saturday’s and Sunday’s. Please visit the SPC site for severe weather updates and information on these days.
https://www.spc.noaa.gov/
The Storm Prediction Center indicates a SLIGHT risk for severe thunderstorms for Wed., and Thu. The following graphics are linked to their outlooks:
DAY 2 OUTLOOK:
DAY 3 OUTLOOK:
SPC DAY 4 – 8 OUTLOOK: 
IF 1300Z SPC DAY 1 outlook graphics are utilized, please check the SPC site for any updates to the outline risks when they are issued. The next update is issued at 1630Z (12:30 p.m. EDT)
CURRENT DAY1 SEVERE WEATHER OUTLOOK
The Storm Prediction Center (SPC) has issued a SLIGHT risk for severe thunderstorms in the current DAY1 Outlook: OVER PARTS OF THE NORTHERN PLAINS…
…SPC SUMMARY…
Thunderstorms with large hail, severe wind gusts and potentially a couple of tornadoes are expected this afternoon and evening in parts of the northern Plains. Strong wind gusts and marginal hail will also be possible in parts of the southern and central High Plains. A few severe wind gusts may also occur from southern Georgia into northern and eastern Florida.
The hatched areas you occasionally see in the graphics are referred to as a CIG (Conditional Intensity Grouping), and is explained in the links below:
The following is from the SPC and NWS explaining this feature:
https://www.spc.noaa.gov/exper/conditional-intensity-information/
https://www.weather.gov/news/262402-spc
Based on analysis of mainly model and current radar animations, the current outlook, and analysis of indices, the strongest storms and indices should occur approximately between mid afternoon through the end of early evening. Please visit the SPC homepage via the link provided for any changes to the forecast today.
CAPE VALUES FORECAST
DEW POINT FORECAST
Indices were analyzed from the NAM 3KM, HRRR 3KM, CIPS DETERMINISTIC, and SPC SREF model guidance.
REGARDING EHI VALUES: While EHI values are calculated utilizing MLCAPE and 0 – 3 km SRH values (MLCAPE x 0 – 3 km SRH /160,000) FOR SUPERCELL development, MLCAPE and 0 -1 km SRH are used for tornado development. The highest SRH values do not always fall within ample, highest MLCAPE values for the best probability of tornado activity. Supercell EHI values should be regarded as to how strong supercells may become, and not the reference of tornado intensities listed. Tornadic EHI should be used to determine the probable strength of any tornadoes. I utilize the SRH and MLCAPE values over the area that has the highest tornado risk potential. Maximum EHI values are calculated within the area(s) that have the greatest probability for tornado activity.
If there is a lack of sufficient 0 – 1 km SRH, effective (EFF.) SRH will be used in calculation of tornadic EHI. From research: (Effective Layer SRH: Recent research suggests using “effective layer” SRH (usually 1250-2250m AGL) as a superior substitute for 0-1 km SRH, as it better represents the inflow layer for supercells).
EHI INDICES are for the guidelines listed above. Listed indices will always pertain to the area(s) located within the highest SPC risk outlines, based mainly on SBCAPE indices, and / or regarding a higher tornado potential, should multiple severe risk areas appear in the SPC forecast. Although certain indices may appear stronger on a forecast map, given the lack of other indices does not contribute to the overall severe risk. Bear in mind, MAXIMUM indices recorded below are for the time of peak intensity. Some indices meanings are posted below the indices themselves, and the NWS page containing a more extensive explanation can be accessed further on in the synopsis.
The following were the forecast parameters and indices analyzed this morning within the SLIGHT risk outline and the 15% HATCHED HAIL OUTLINE:
SBCAPE: 1000 – 3000 j/kg-1
MLCAPE: 1000 – 2500 j/kg-1
MUCAPE: 1000 – 3000 j/kg-1
SRH 0 -1 km: 50 – 125 m2/s2
SRH 0 -3 km: 100 – 250 m2/s2
SRH EFFECTIVE: 50 – 150 m2/s2
L. I.: -3 to -9
SCP: 1 – 10
STP: 0.4 – 1.1
0 -6 km SHEAR: 30 kts – 50 kts
EFF. SHEAR: 30 kts – 50 kts
MID LEVEL LAPSE RATE: 6.5C – 8.5C
DEWPOINT: 50F – 63F
SUPERCELL EHI : 1.3 – 2.3
TORNADIC EHI : 0.6 – 1.2
TOTAL TOTALS INDEX: 55C
K INDEX: 28C to 40C
SWEAT INDEX: 440 – 535
THOMPSON INDEX: 31 to 49
CRAVEN – BROOKS INDEX: 10,000 – 30,000
The following are some severe weather parameters and indices explanations:
CAPE 
ENERGY HELICITY INDEX
K INDEX
TOTAL TOTALS INDEX
STORM RELATIVE HELICITY
LIFTED INDEX
SWEAT VALUES
THOMPSON INDEX
Craven SigSvr Parameter:
The simple product of 100mb MLCAPE and 0-6km magnitude of the vector difference (m/s; often referred to as “deep layer shear”) accounts for the compensation between instability and shear magnitude. Using a database of about 60,000 soundings, the majority of significant severe events (2+ inch hail, 65+ knot winds, F2+ tornadoes) occur when the product exceeds 20,000 m3/s3.
A little fact on SRH values and tornadoes from NOAA / NWS
Storm Relative Helicity (m2 s-2)
SRH (Storm Relative Helicity) is a measure of the potential for cyclonic updraft rotation in right-moving supercells, and is calculated for the lowest 1-km and 3-km layers above ground level. There is no clear threshold value for SRH when forecasting supercells, since the formation of supercells appears to be related more strongly to the deeper layer vertical shear. Larger values of 0-3-km SRH (greater than 250 m2 s-2) and 0-1-km SRH (greater than 100 m2 s-2), however, do suggest an increased threat of tornadoes with supercells. For SRH, larger values are generally better, but there are no clear thresholds between non-tornadic and significant tornadic supercells.
STP ( Significant Tornado Parameter) EXPLAINED:
A majority of significant tornadoes (EF2 or greater damage) have been associated with STP values greater than 1, while most non-tornadic supercells have been associated with values less than 1 in a large sample of RAP analysis proximity soundings.
SCP (Supercell Composite Parameter) EXPLAINED:
A multiple ingredient, composite index that includes effective storm-relative helicity (ESRH, based on Bunkers right supercell motion), most unstable parcel CAPE (muCAPE) and convective inhibition (muCIN), and effective bulk wind difference (EBWD). Each ingredient is normalized to supercell “threshold” values, and larger values of SCP denote greater “overlap” in the three supercell ingredients. Only positive values of SCP are displayed, which correspond to environments favoring right-moving (cyclonic) supercells.
The following are the SCP (Supercell Composite Parameter) and STP (Significant Tornado Parameter) forecast maps from the NAM 3KM model. Generally, the higher the values and brighter the color, indicates a greater probability of strong thunderstorm and / or tornadic activity over an area:
NAM 3KM SCP FORECAST 1:00 P.M. CDT JUN 02 – 11:00 P.M. CDT JUN 02
NAM 3KM STP FORECAST 1:00 P.M. CDT JUN 02– 11:00 P.M. CDT JUN 02
NAM 3KM RADAR SIMULATION 1:00 P.M. CDT JUN 02 – 11:00 P.M. CDT JUN 02
https://www.spc.noaa.gov/classic.html
SPC MESOSCALE DISCUSSIONS (CLICK IMAGE FOR UPDATES)
SPC CONVECTIVE WATCHES (CLICK IMAGE FOR UPDATES)
The following sites will explain most of the severe weather and tornado values listed above, and will give you an idea of what to expect:
ENVIRONMENTAL INDICES AND PARAMETERS NWS
https://www.weather.gov/lmk/indices
THE WEATHER PREDICTION
http://www.theweatherprediction.com/severe/indices/
The following links will connect you to the Excessive Rainfall probabilities and River Flood Outlook:
EXCESSIVE RAINFALL
https://www.wpc.ncep.noaa.gov/qpf/excessive_rainfall_outlook_ero.php
SIGNIFICANT RIVER FLOOD OUTLOOK
https://www.wpc.ncep.noaa.gov/nationalfloodoutlook/index.html
The following NWS Watch / Warning map will provide local NWS information for your area. Click the image, then once it refreshes, click on your area of interest to view forecasts, any special weather statements, hazards or advisories for your area.
IF A TORNADO WARNING IS ISSUED FOR YOUR AREA…SEEK STURDY AND SAFE SHELTER IMMEDIATELY!
NWS WATCH / WARNING DISPLAY (LINKED…CLICK MAP, THEN YOUR AREA)
NWS DOPPLER RADAR LOOP (LINKED, CLICK RADAR MAP)
RAP RADAR (CLICK IMAGE THEN GO TO LOOP DURATION AND PICK LENGTH OF LOOP, THEN CLICK RADAR SITE)
WUNDERGROUND RADAR SUMMARY MAP (CLICK FOR UPDATES)
PRECIPITATION TYPE (CLICK TO ACCESS ANIMATION FEATURE)
CARIBBEAN RADAR (CLICK IMAGE TO ACCESS ANIMATION)
You may direct any questions by contacting me personally, ANYTIME, at: [email protected]
Have a blessed day!
T. F. “STORM” WALSH III
GMCS, USCG (ret)
METEOROLOGIST / HURRICANE SPECIALIST / SEVERE WEATHER SPECIALIST
CoCoRAHS OBSERVER


 English (US) ·
  French (CA) ·